Contents
TVU Media Analyzer Quick Start User Guide
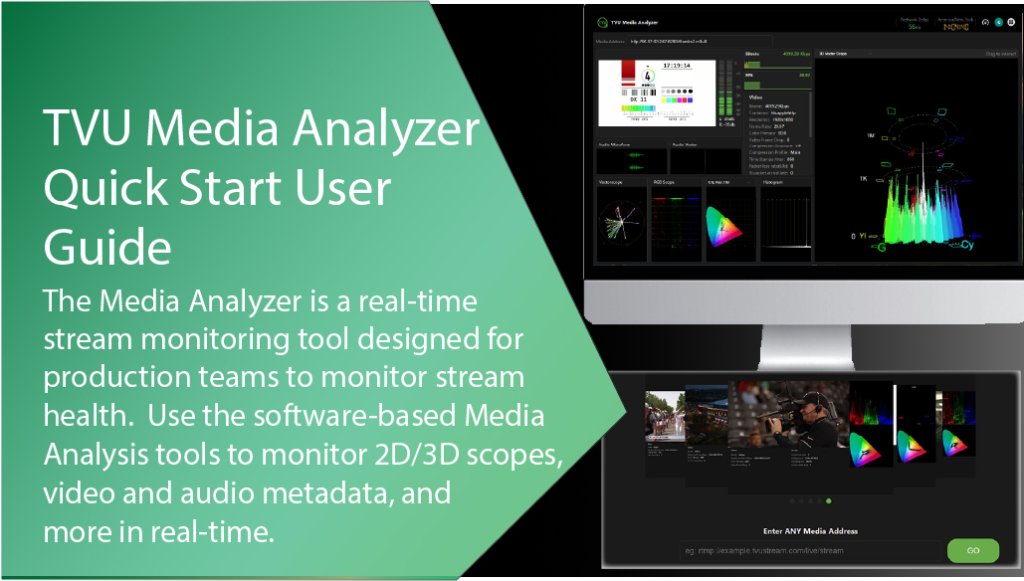
The Media Analyzer is a real-time stream monitoring tool designed for production teams to monitor stream health. IP stream monitoring traditionally requires routing the video stream to a hardware decoder, which is converted to SDI and then connected to a traditional scope. TVUs Media Analyzer is software-based, IP-friendly, and provides instant monitoring by entering any media address link.
This guide provides step-by-step instructions for using the TVU Media Analyzer tool.
TVU Media Analyzer Advantages
TVU Media Analyzer supports the following Analysis Tools:
2D Scopes
- Vector Scope
- CIE Plot
- Histogram
- RGB Parade
- Audio Level Meter
- Audio waveform
- Audio Vector Scope
3D Scopes
- 3D Vector Scope
- 3D CIE Plot
- 3D RGB
Metadata Analysis
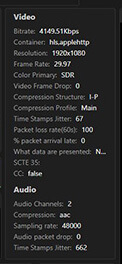
- Video metadata: The metadata panel displays the following Video data Bitrate, Resolution/Frame Rate, Color Primary (SDR), Video Frame Drop, Container, Compression Structure, Compression Profile, Time Stamps Jitter, Packet loss rate (60s), % packet arrival late, What data are presented, SCTE 35, and CC.
- Audio metadata: The metadata panel displays the following Audio data: Audio Channels, Compression, Sampling Rate, Audio Packet Drop, and Time Stamp Jitter.
Key features
- Supported sources: RTP, RTMP, SRT, HLS, YouTube, Facebook, and TikTok.
- Media Analyzer can be injected at multiple points in the signal path.
- Users can monitor the incoming RTP source for encoding.
- Users can monitor the SRT output from a production tool such as TVU Producer, or the CDN output HLS source after delivery.
Before you begin
Users will first need to contact TVU Support to enable TVU Media Analyzer.
Signing in to TVU Media Analyzer
There are two methods available to sign in to TVU Media Analyzer:
- From the TVU Command Center services waffle.
- Sign in to the TVU Media Analyzer web interface.
Command Center access
- Sign in to your Command Center account.
- Click the Services icon at the top right of the Command Center screen.
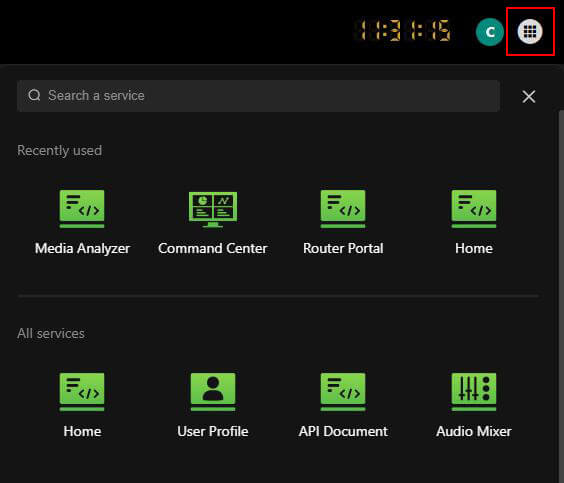
- Locate and click Media Analyzer.
- TVU Media Analyzer will display.
- Continue with “Adding a source to TVU Media Analyzer.”
Sign in to the Media Analyzer user interface
- Open a new browser tab and enter: https://media-analyzer.tvunetworks.com/mediaAnalyzer/#/home
- Click Enter.
- The TVU Media Analyzer Sign in page will display.
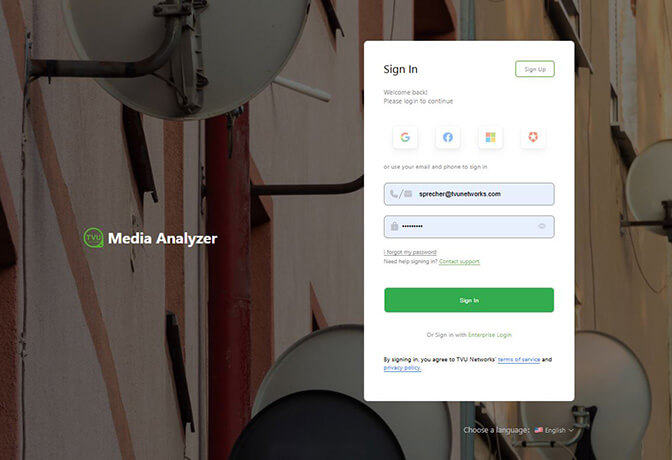
- Enter your User ID and Password.
- Click Sign In.
- Continue with “Adding a source to TVU Media Analyzer.”
Adding a source to TVU Media Analyzer
To add a source to Media Analyzer:
- In the Media Address field, enter an RTP, RTMP, SRT, HLS, YouTube, Facebook, or TikTok URL, then click GO.
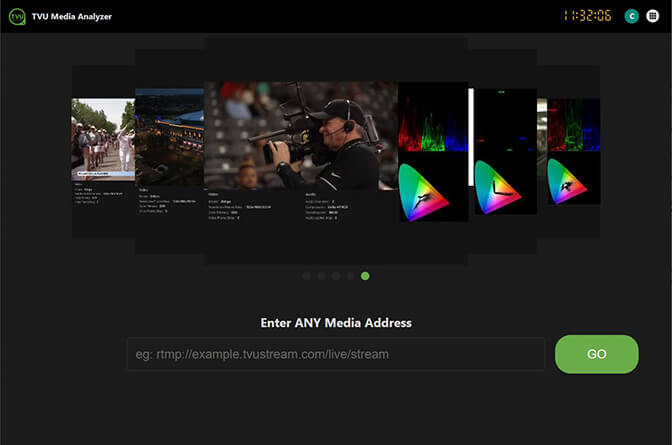
- The Analyzing stream page will display.
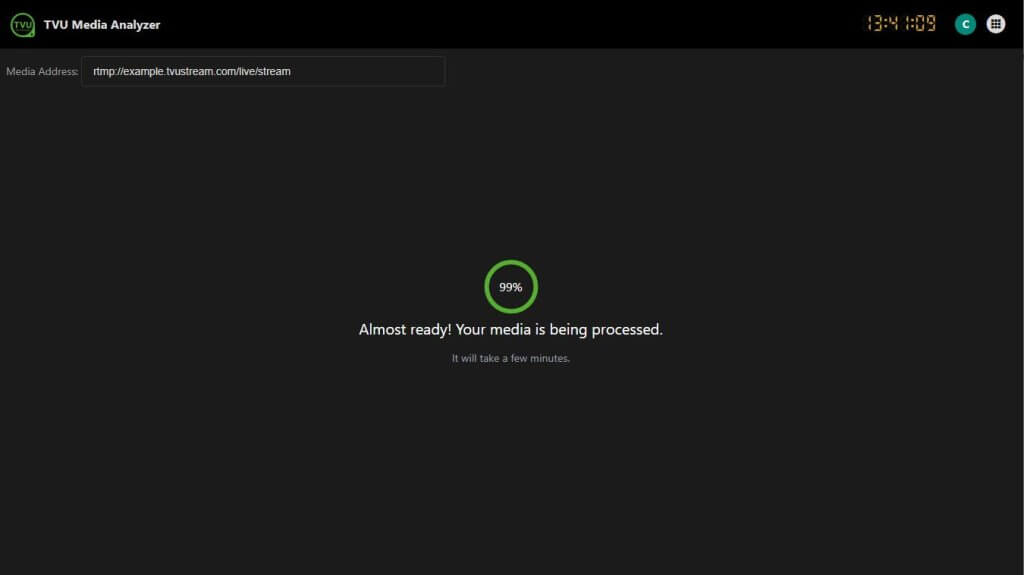
- When the countdown reaches 100%, the Media Analyzer page will display.
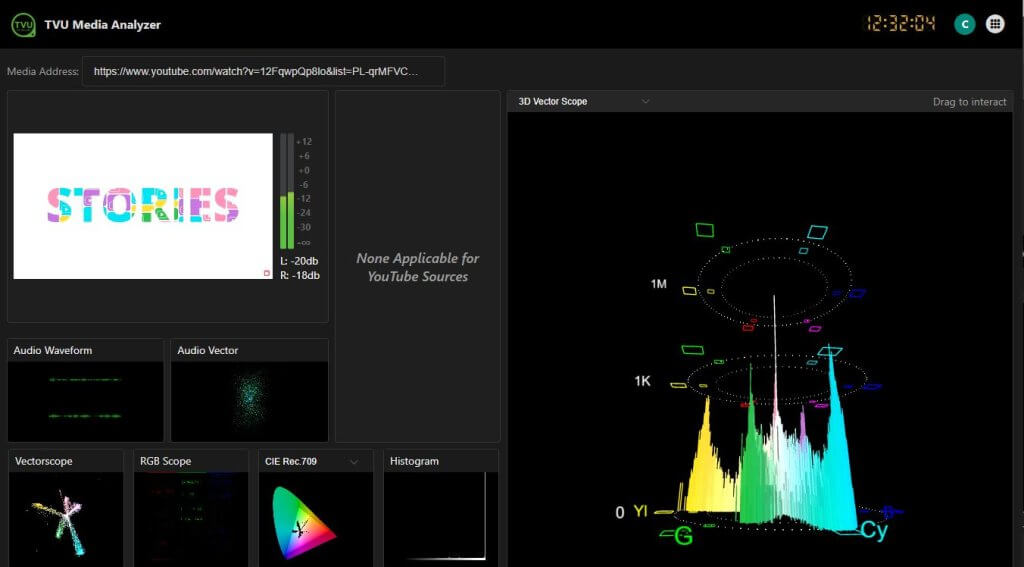
Note: Facebook, TikTok, and YouTube sources do not support metadata.
When entering Facebook, TikTok and YouTube sources, the metadata panel will display a “Not Applicable” message in the metadata panel.
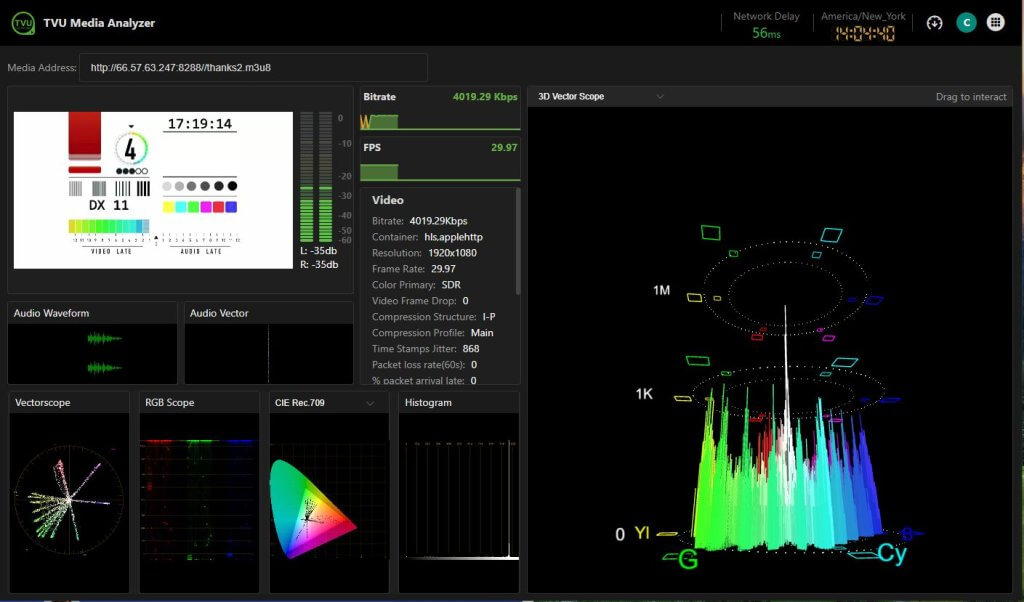
TVU Media Analyzer controls and functions
The Media Analyzer page has the following controls and functions.

(A) Media address – This field displays your source URL.
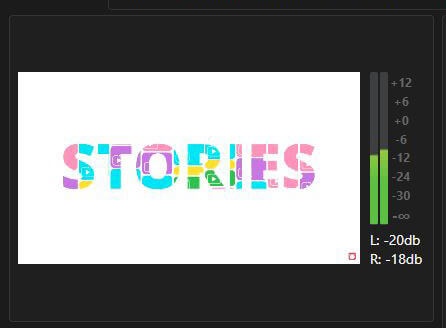
(B) Video preview panel – This preview panel displays a preview of your video stream and the corresponding two-channel audio levels.
(C) dBFS Audio level Meter – The Decibels relative to full scale (dBFS) is a unit of measurement for amplitude levels in digital systems, such as pulse-code modulation (PCM), which have a defined maximum peak level.
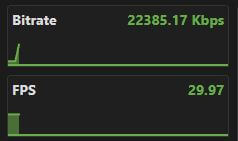
(D) Bitrate display panel – This panel displays a real-time graphical representation of the video stream bitrate.
(E) Frames Per Second (FPS) display panel – This panel displays a graphical representation of the video stream FPS metric, which indicates how many consecutive images are captured or displayed in one second.
(F) Video and Audio Metadata panel – This panel displays the video and audio metadata associated with your video stream.
(G) Interactive Scope panel – This panel displays the interactive 3D CIE, RGB, and Vector scopes.
(H) User Preferences menu – Click the Preferences icon to access the Token Purchasing Portal and Commitment Management page.
(I) Audio Waveform display panel – The Audio Waveform panel displays a graphical representation of amplitude or level changes over time.
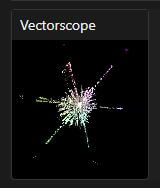
(J) Vector Scope display panel – The vectorscope is a specialized oscilloscope used primarily in video applications to visualize chrominance signals, which represent color information in a video signal. It displays an X-Y plot that helps technicians analyze the relationship between different color components, ensuring accurate broadcast color reproduction. The image’s color channels are shown as “vectors” on the vector scope, with the length of the vector representing the saturation of the color and the vector’s angle representing the hue.
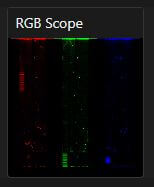
(K) RGB Scope display panel – RGB scope refers to a tool used in video editing and color correction that displays the levels of red, green, and blue color channels in an image. It helps users evaluate and adjust color balance and saturation to ensure accurate color reproduction in video projects.
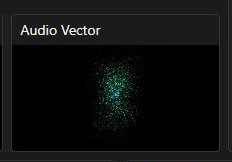
(L) Audio Vector display panel – An audio vectorscope is a tool for monitoring and analyzing a recording’s audio signals. It graphs the audio signal over time as a group of circular lines, or vectors. It is most commonly used for sound mixing and mastering, but it can also be used for audio production and troubleshooting.
(M) CIE Rec display panel – The International Commission on Illumination (CIE) panels plot real-world colors, and the gamut of real-world colors is displayed visually. This panel shows a graphical image of the CIE Rec.709 and CIE Rec.2020 color spaces.
(N) Histogram display panel – A histogram is a graphical representation that shows the distribution of numerical data by grouping values into ranges, called bins, and displaying the frequency of data points within each bin as vertical bars. It helps visualize patterns and trends in the data.
This panel is a graphical image of the Histogram. More options include a fullscreen view and unmute.
(O) Network Delay – Displays the current Network Delay in ms.
(P) Download Speed Test icon – Click this icon to download the current speed test.
Video preview panel
The video preview panel allows the user to monitor the video stream and Audio levels in real-time.
Metadata panel
The metadata panel allows the user to monitor the Video and Audio metadata of the video stream in real-time.
Bitrate and FPS panels
The Frames Per Second (FPS) panel displays how many consecutive images are captured or displayed in one second.
Interactive scope panel controls
Scopes are visual tools used to measure and display different properties of your video footage, such as brightness (luminance) and color (chrominance). Waveform monitors, vectorscopes, and histograms are some examples of scopes.
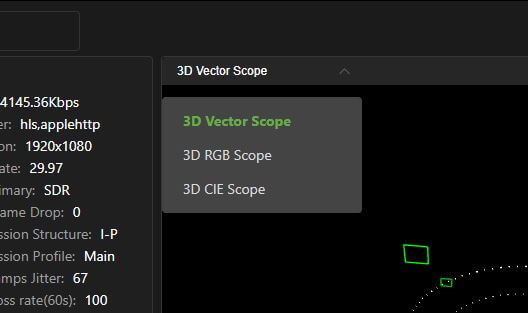
The interactive scope panel allows a user to monitor and interact with the 3D CIE, 3D RGB, and 3D vector scopes in real-time. The user can click and drag their mouse to display a 360 degree angle the Hue and saturation levels of your video and how many pixels are applied to the same color, and the saturation levels.
To display a specific scope:
- Click the drop-down menu at the top of the scope panel.
- Select the desired Scope.
Scope panel examples
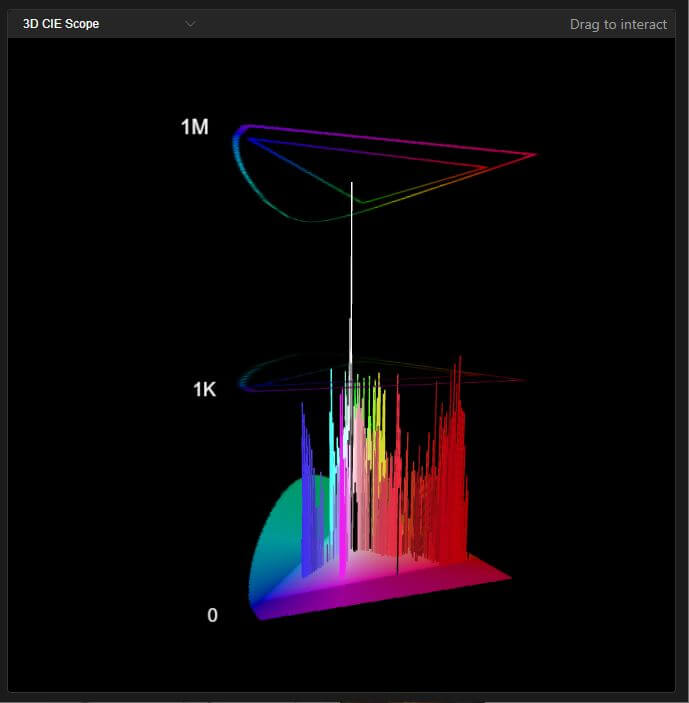
Media Analyzer page – 3D CIE scope
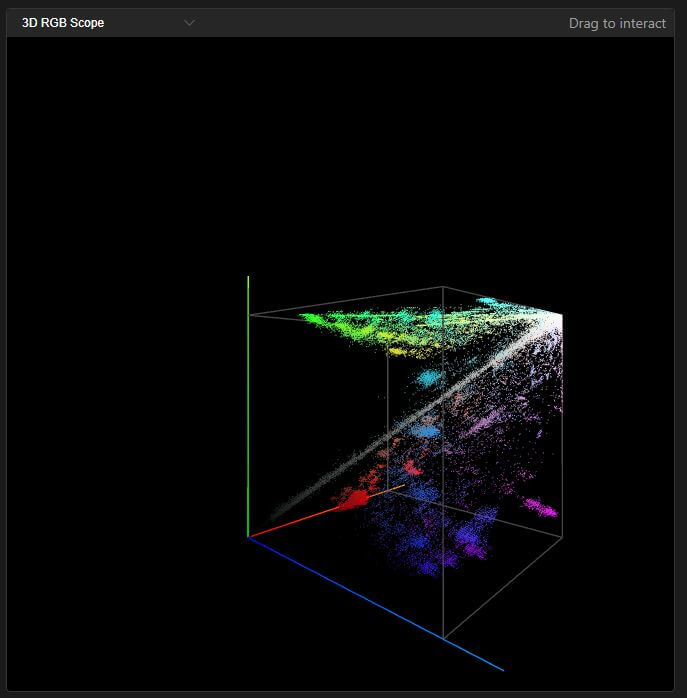
Media Analyzer page – 3D RGB scope
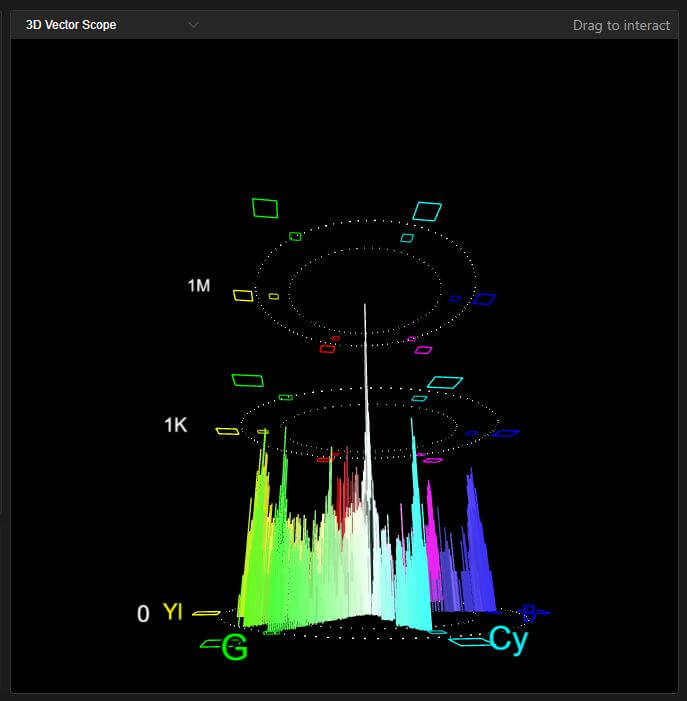
Media Analyzer page – 3D Vector scope
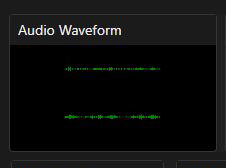
Audio Waveform panel
The Audio Waveform panel visually represents digitized sound, showing amplitude or level changes over time. Amplitude has positive and negative values, representing the compressions and rarefactions of sound waves, respectively.
Monitoring Waveforms also helps audio producers to optimize the dynamic range, frequency balance, and stereo imaging of audio mixes, resulting in a more balanced and cohesive sound.
- To view the Audio Waveform panel in fullscreen, hover your mouse to display and click the fullscreen icon.
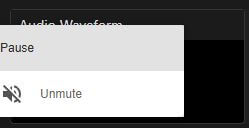
- To pause or unmute the Audio Waveform, click the three-dot icon to open the menu options.
- Click the desired menu option.
Audio Vector panel
An audio vectorscope is a tool to visualize the relationship between two audio signals, typically in stereo. It displays the signals on an X-Y plot, allowing users to see how the left and right channels interact, which can help assess stereo separation and phase alignment.
- To view the Audio Vector panel in fullscreen, hover your mouse to display and click the fullscreen icon.
- To pause or unmute the Audio Vector, click the three-dot icon to open the menu options.
- Click the desired menu option.
Vectorscope panel
The Vectorscope panel displays a circular graph showing a video signal’s color and saturation information. The horizontal axis represents the color along the blue-yellow (B-Y) axis. In contrast, the two diagonal axes represent the color along the red-cyan (R-CY) axis and green-magenta (G-MG) axis, respectively. The center of the vector scope represents neutral colors (white and black), while the outer edge represents the most saturated colors (100% saturation).
- To view the Vectorscope in fullscreen or to unmute the Vectorscope audio, hover your mouse to display the panel options.
- Click the desired icon.
RGB Scope panel
In broadcast video production, R’G’B’ values are defined in terms of voltage ranges. R’G’B’ signals extending outside the specified voltage range, or gamut, may become clipped or compressed in subsequent signal processing. The RGB Scope panel allows users to monitor the proper gamut in RGB Parade format, which displays the waveform for the three colors side-by-side, of repurposed content and cross-platform redistribution of broadcast content.
- To view the RGB Scope in fullscreen or to unmute the RGB scope audio, hover your mouse to display the panel options.
- Click the desired icon.
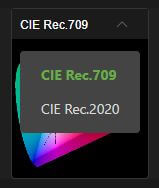
CIE Rec panel menu
To display the CIE Rec.709 or CIE Rec.2020 panel:
Click the top drop-down menu and make a selection.
CIE Rec.709
Rec. 709, also known as ITU-R Recommendation 709, is a standard for high-definition television that defines the color encoding and signal characteristics for digital images. It specifies a wide screen format with a 16:9 aspect ratio and uses the RGB color model to represent colors as red, green, and blue mixtures.
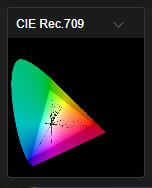
- To view the CIE Rec.709 color space in fullscreen or to unmute the CIE Rec.709 audio, hover your mouse to display the panel options.
- Click the desired icon.
CIE Rec.2020
The Rec. 2020 addresses an expanded color gamut. Rec. 709, also known as ITU-R Recommendation 709, is a standard for high-definition television that defines the color encoding and signal characteristics for digital images. It specifies a wide screen format with a 16:9 aspect ratio and uses the RGB color model to represent colors as mixtures of red, green, and blue.
Rec. 2020 is a more advanced color space, including more saturated greens, blues, and reds. Rec. 2020 is also used for HDR (High Dynamic Range) content, making it ideal for professional applications requiring superior image quality and color fidelity.
Rec. 2020 offers a much broader color gamut, ideal for 4K and Ultra HD content.
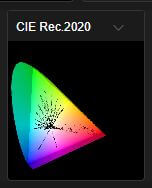
- To view the CIE Rec.2020 color space in fullscreen or to unmute the CIE Rec.2020 audio, hover your mouse to display the panel options.
- Click the desired icon.
Histogram panel
The Histogram panel shows a user the distribution of dark and bright pixels in the video stream. The left side of the Histogram shows the dark pixels, and the right side shows the brightest pixels. The height of the curve tells us how many pixels we have with a given brightness.
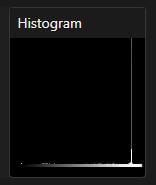
- To view the Histogram in fullscreen or to unmute the audio, hover your mouse to display the panel options.
- Click the desired icon.
© Copyright 2025 TVU Networks Corporation, All rights reserved in all media.
Document Part Number: TVU Media Analyzer QSUG Rev A EN 08-2025